Okta is a Single Sign-On identity provider with a lot of nice features to do advanced identity management. This post covers how to integrate the System Log from Okta, which contains all of it’s audit events, and connect it to a Graylog system. This is part of a series of posts about better leveraging and using Graylog with a variety of solutions. Code snippets, scripts, etc can be found here: https://github.com/theabraxas/Graylog-Okta
Table of Contents
- Okta events and how to see them
- Retrieving logs with Powershell
- Ingesting logs with FileBeat / Graylog Sidecar
- Pipelines to improve enrich the data!
- Using the new data!
Okta Events
Okta has a very easy to use API which we can use to pull the system log events. The system log in Okta is where all audit events go. Sign-ons, user agents, config changes and everything else end up in the system log. This page details what we’re trying to retrieve with the system log: https://developer.okta.com/docs/reference/api/system-log/
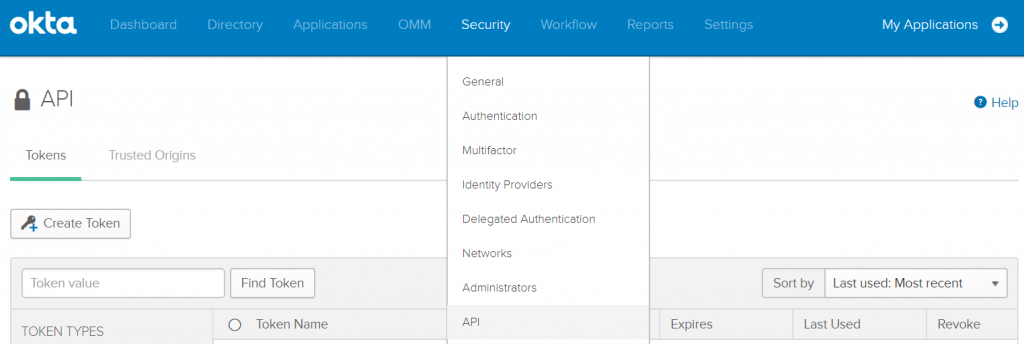
Before you can access the API you need to generate an API token, this can be done by going to your Okta Admin portal and going to Security -> API -> Create Token like below
Armed with an API token we can now write a quick PowerShell script to start interrogating Okta. There is a freely available PowerShell Okta Module availabe ( https://github.com/mbegan/Okta-PSModule ) but I decided to build this from scratch since we only need a few very specific things.
After looking in to the API documentation I came up with the following requirements to query the API:
– Token – this is what you were issued while setting up your API integration above.
– Headers – The token, accept and content type headers all need to be present.
– URL (this is determined by your Tenant name – if you go to https://companyA.okta.com to leverage Okta, you would have an API url of: https://companyA.okta.com/api/v1/ In our case, we’ll be using the logs endpoint.
Retrieving logs with PowerShell!
With the above requirements we can create the following couple of variables in our script. I’ll be using ‘CompanyA’ as my example tenant, replace this with your actual Okta tenant name.
$URI= "https://CompanyA.okta.com/api/v1/"
$Token = "MYt0pSeCr3tTok3nFr0m@b0v3!"
$headers = @{}
$Headers = @{"Authorization" = "SSWS $token"; "Accept" = "application/json"; "Content-Type" = "application/json"}
[Net.ServicePointManager]::SecurityProtocol = [Net.SecurityProtocolType]::Tls12 #This just allows for TLS1.2 while the script is running.
To query this the way I want to, I need a defined start and end date. Okta leverage datetimes in the format of yyyy-MM-dd'T'HH:mm:ss'Z' I created some quick functions to get up to the last minute for last hour for testing:
function Get-EndDate{
    $EndDate = (Get-date).AddMinutes(-1)
    return Get-Date $EndDate -Format "yyyy-MM-dd'T'HH:mm:ss'Z'"
}
function Get-FirstStartDate{
    $StartDate = (Get-Date).AddMinutes(-60)
    return Get-Date $StartDate -Format "yyyy-MM-dd'T'HH:mm:ss'Z'"
}
Once defined, I use these two functions to quickly generate times and we are now good to test our script! A few things to note – the actual data is in the $Result.Content part of the response, additionally, there is an optional next link in the link header which includes a new URI if there are more than the maximum number of results available in your time period (Okta can only deliver 1000 results at a time)
function Get-EndDate{
    $EndDate = (Get-date).AddMinutes(-1)
    return Get-Date $EndDate -Format "yyyy-MM-dd'T'HH:mm:ss'Z'"
}
function Get-FirstStartDate{
    $StartDate = (Get-Date).AddMinutes(-60)
    return Get-Date $StartDate -Format "yyyy-MM-dd'T'HH:mm:ss'Z'"
}
$StartDate = Get-FirstStartDate
$EndDate = Get-EndDate

URI= "https://CompanyA.okta.com/api/v1/?since=$StartDate&until=$EndDate&limit=1000"
$Token = "MYt0pSeCr3tTok3nFr0m@b0v3!"
$headers = @{}
$Headers = @{"Authorization" = "SSWS $token"; "Accept" = "application/json"; "Content-Type" = "application/json"}
[Net.ServicePointManager]::SecurityProtocol = [Net.SecurityProtocolType]::Tls12 #This just allows for TLS1.2 while the script is running.

While ($true) {
    $Result = Invoke-WebRequest -Headers $headers -Method GET -URI $uri
    $link = $Result.headers['link'] -split ","
    $next = $link[1] -split ";"
    $next = $next[0] -replace "<",""
    $next = $next -replace ">",""
    $Result.headers['link']
    If (-not ($next)) {
        $EndDate | Out-File $StartDatePath
        break
    }
    $uri = $next
    $jsonData = ConvertFrom-Json $([String]::new($Result.Content))
    Foreach ($log in $jsonData) {
        $log | ConvertTo-Json -Compress | Out-File -FilePath "C:/Some/Output/Pat/OktaLog.json" -Append -Encoding ascii
    }
    Sleep -Milliseconds 600 #prevents being timed out by Okta's rate limiting.
}
We now have logs! A more comprehensive script is available on my github at: https://github.com/theabraxas/Graylog-Okta. The code sets it up to run every couple of minutes to pull all new logs. It also writes the last log request time to a file so we don’t miss anything!
The next step is to take these logs and get them in to Graylog. There are a couple of ways to do this – including sending them as a TCP stream but I opted to use the Graylog Sidecar for a few reasons!
Sending Logs with the Graylog Sidecar
The Graylog Sidecar is a program which manages a few programs like FileBeat and LogBeat from Elastic or others like NXLog. It essentially manages those programs by giving them configuration files from the central Graylog server and telling them how to run. It also can be installed as a service to increase reliability, etc.
We are, from the previous step, writing logs to C:/Some/Output/Path/OktaLog.json currently and want to have the Sidecar tell WinLogBeat to watch that file. To do this, we go to Graylog -> System -> Sidecars -> Configuration and create a new FileBeat configuration! (you can also append to an existing one if it makes more sense.
Our configuration will be quite generic and look like this, you need to input your Graylog hostname and associated Beats input port under output.logstash The path is just added under the -paths header and should just be your desired filename.
# Needed for Graylog
fields_under_root: true
fields.collector_node_id: ${sidecar.nodeName}
fields.gl2_source_collector: ${sidecar.nodeId}

output.logstash:
   hosts: ["yourGraylogHostname.YourDomain.com:9876"]
path:
  data: C:\Program Files\Graylog\sidecar\cache\filebeat\data
  logs: C:\Program Files\Graylog\sidecar\logs
tags:
 - windows
filebeat.inputs:
- paths:
   - C:\Some\Output\Path\OktaLog.json
  input_type: log
  type: log
Once the configuration is complete, attach it to the Graylog sidecar host which your powershell script is running on and you will start receiving logs! You’ll notice a few issues though, first, the data is not at the correct timestamp, it’s only showing when Graylog received it, not the timestamp in the message. The messages are also just a huge blob of JSON and it’s not really searchable in a usable fashion. The next section will fix that!
Pipelines to improve the data
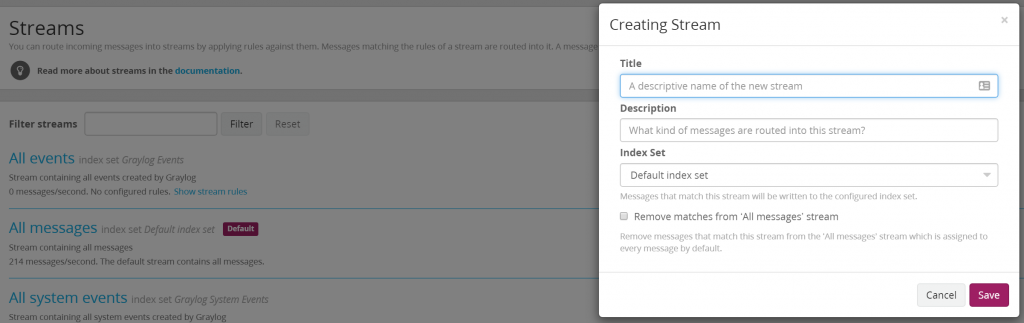
Pipelines are ways to modify data after is has been received by Graylog. For clarity I will also walk you through creating a stream for the Okta events. First, click the ‘Streams’ toolbar option in Graylog and select to create a new stream, I call mine “Okta Stream”. I also have it ‘remove messages from the All Messages stream.
Once the stream is created, we need a rule to capture the events. Do this by clicking ‘Manage Rules’ on your newly created stream and then click to ‘Add Stream Rule’. FileBeat creates a field called filebeat_source which has a value of the source file used to generate that filebeat log. We will set our rule to add messages to the stream when the filebeat_source is equal to our filename C:/Some/Output/Path/OktaLog.json
Now that the stream exists we will go and make a new Pipeline Rule and then attach that rule to a message stream. To do this, go to System -> Pipelines -> Manage Rules and select ‘Create Rule’.
rule "Extract Okta Data"
when
  contains(to_string($message.filebeat_source),"C:\\Some\\Output\\Path\\OktaLog.json",true)
then
  let json_data = parse_json(to_string($message.message));
  let json_map = to_map(json_data);
  set_fields(json_map,"_okta_");
  let new_date = to_string($message._okta_published);
  let new_timestamp= (parse_date(value: to_string(new_date),pattern: "YYYY-MM-dd'T'HH:mm:ss.SSS'Z'",timezone: "America/Los_Angeles"));
  set_field("timestamp",(new_timestamp));
end
The above is a pretty simple rule. First we check if the source of the log is correct. All messages in this stream should match that rule but we check anyways. Once it matches we take the body of the message $message.message and run the parse_json function on it. JSON can then be converted to a map datatype with the to_map function which is important because set_fields – the function which turns each key/value from our message in to separate fields only accepts map objects.
Run set_fields to cast our map to fields in the message. Next, we adjust the timestamp with let new_date and let new_timestamp which take the data from the _okta_published field (published is one of the JSON keys so we know it exists). Then we convert that field to a datetime. Last, we set the timestamp field to the value we just created; that moves the message to the appropriate timestamp in Graylog.
The data looks much better now but there are still a number of fields with JSON strings….
Pipelines….again
@Joe went through those and created a new pipeline rule to expand all of the nested JSON fields. To do this, we identified all of the common field names by scanning through the different logs. With that data, we create a stage 2 pipeline rule which expand the expandable fields. Last, we remove the original value as we don’t want duplicate data. Each field gets its own prefix to keep things organized.
rule "Okta post processing"
when
  contains(to_string($message."_okta_actor"), "id")
then
  set_fields(to_map($message._okta_actor), "_okta_actor_");
  remove_field("_okta_actor");
  set_fields(to_map($message._okta_authenticationContext), "_okta_authenticationContext_");
  remove_field("_okta_authenticationContext");
  set_fields(to_map($message._okta_client), "_okta_client_");
  remove_field("_okta_client");
  set_fields(to_map($message._okta_client_userAgent), "_okta_client_userAgent_");
  remove_field("_okta_client_userAgent");
  set_fields(to_map($message._okta_client_os), "_okta_client_os_");
  remove_field("_okta_client_os");
  set_fields(to_map($message._okta_client_browser), "_okta_client_browser_");
  remove_field("_okta_client_browser");
  set_fields(to_map($message._okta_client_geographicalContext), "_okta_client_geographicalContext_");
  remove_field("_okta_client_geographicalContext");
  set_fields(to_map($message._okta_debugContext), "_okta_debugContext_");
  remove_field("_okta_debugContext");
  set_fields(to_map($message._okta_debugContext_debugData), "_okta_debugContext_debugData_");
  remove_field("_okta_debugContext_debugData");
  set_fields(to_map($message._okta_outcome), "_okta_outcome_");
  remove_field("_okta_outcome");
  set_fields(to_map($message._okta_request), "_okta_request_");
  remove_field("_okta_request");
  set_fields(to_map($message._okta_securityContext), "_okta_securityContext_");
  remove_field("_okta_securityContext");
  set_fields(to_map($message._okta_transaction), "_okta_transaction_");
  remove_field("_okta_transaction");
end
Next, there are some fields we want to further enrich – such as the IP addresses. For example, we can determine with a pipeline rule if there are risks associated with the IP.
NEED TO FILL THIS OUT
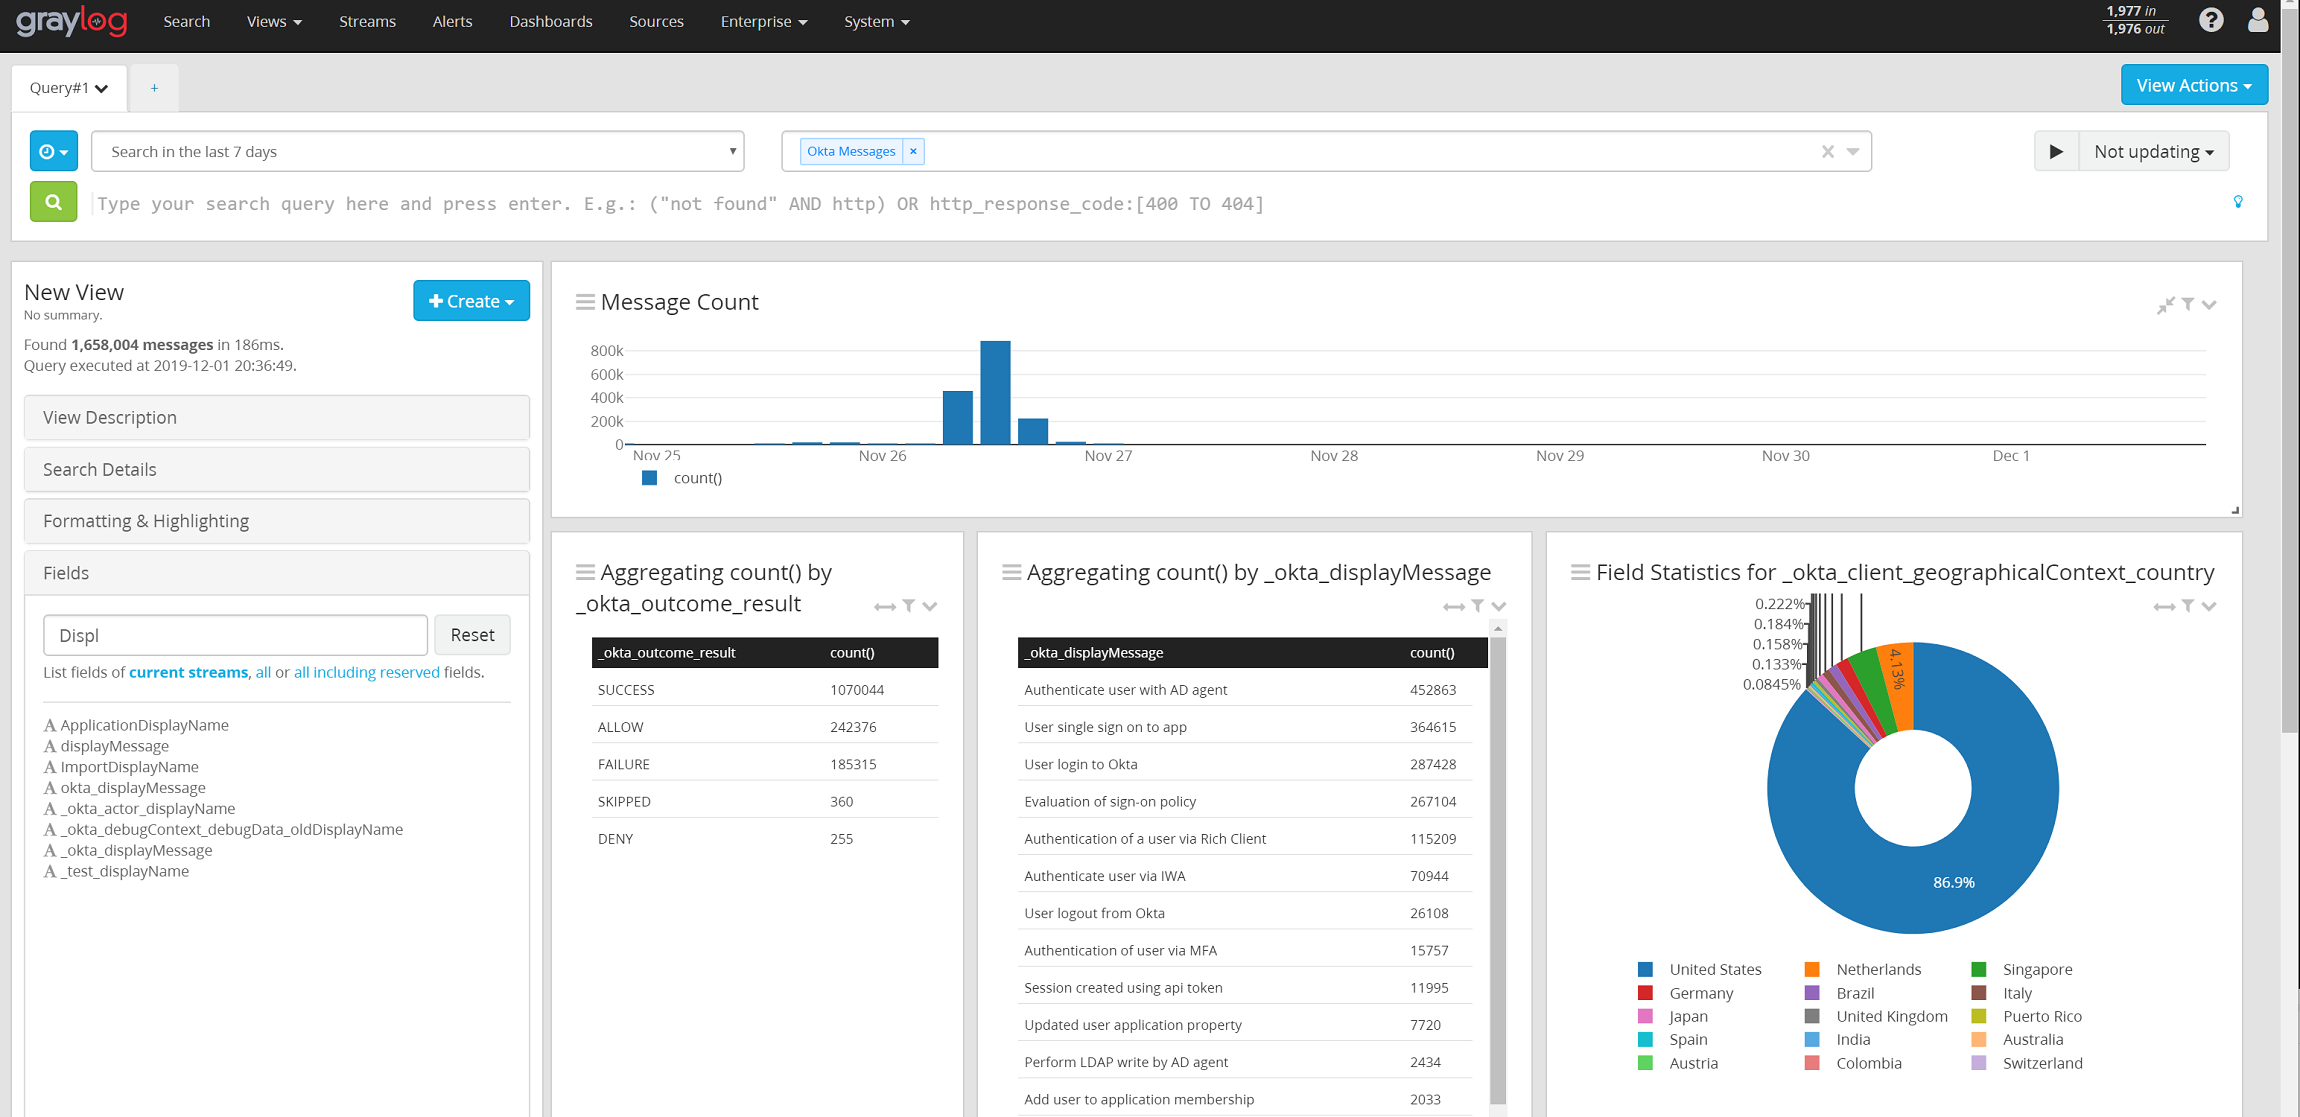
Dashboards and more!
This section will show some of the Dashboards we created and some of the alerts which are now possible. There will also be some ideas on correlation with other data sources.
NEED TO EXPAND BELOW HERE
- OTX lookup on IPs; enrich event with known threat information of connecting IP
Dashboards and Alerts!
This section just has a few ideas of how to use this data right now, as I have time I’ll include more details on how to achieve these goals.
Dashboards:
- Total Logins | Failed Logins over time – This will provide trendable at-a-glance information about anomalous volumes of activity
- Users with most failed connection attempts
- Top IPs with failed connection attempts
- Top Countries with failed connection attempts
- Breadown of connecting devices (Computer, tablet, phone, api) – more interesting than useful
- Configuration changes and user who made them
- Sensitive Application Access – Have a list of all users utilizing sensitive apps and look for deviations in volume, clear accounts who have permission but don’t use it, etc.
Alerts:
- Same IP failed logins for more than 1 account name (Exclude office IPs) in a certain duration
- Configuration Changes
- Connections from a higher-risk countries you don’t do expect logins from (China, Russia, Ukraine, etc.)
This looks great, thanks for posting this. I am going to try to get this set up in the next month or so for our Okta implementation.
Awesome! Please reach out with any questions or if you have improvements or requests!
What input type do i need to receive the logs?
Should i set up a beats input type?
I finally got the logs flowing in to Graylog. This took me a long time to figure out as graylog documentation is a bit confusing for Windows users. Here are the proper instructions.
1. Install Graylog Sidecar on a windows host
2. Created a new filebeat configuration following these directions:
https://www.graylog.org/post/windows-filebeat-configuration-and-graylog-sidecar
3. Set up a sidecar for okta with this config (replacing
I set up the sidecar like this with your collectors IP address:
# Needed for Graylog
fields_under_root: true
fields.collector_node_id: ${sidecar.nodeName}
fields.gl2_source_collector: ${sidecar.nodeId}
output.logstash:
hosts: [“:5044”]
path:
data: C:\Program Files\Graylog\sidecar\cache\filebeat\data
logs: C:\Program Files\Graylog\sidecar\logs
tags:
– windows
filebeat:
inputs:
– type: log
enabled: true
paths:
– C:\logs\okta\*.json
The spacing is all messed up in my last comment. The spacing is crucial for the config to work. Look at this thread to see the spacing:
https://community.graylog.org/t/windows-sidecar-filebeat-exiting-no-modules-or-inputs-enabled/12744/8
Hey @Steve — Sorry it took so long to reply. Yes, I am using the beats type inputs to get these logs in. I’m currently switching all my beats over to a better config (SSL through load balancer and some other things) so did not include my current config.)
Glad you got your logs working — is the parsing working out for you? There’s some work I’m planning to do to better extract the IP information on a few of the fields. If I’m ever slow to reply here ping me on Twitter @AbraxasSC2 – I tend to be more on top of that.
I ended up having issues with the pipeline. Eventually i switched to using SumoLogic’s janus tool and jerry rigged it to just pull the logs for me to a local directory. Then I shipped them with the sidecar and created regular json extractors. Everything seems to be working. I did have to grok out some specific use cases though (Like Cisco VPN RADIUS authentication).
Ahh, that’s awesome!
I ended up writing a post about how I did it using SumoJanus:
https://brakertech.com/ingesting-okta-logs-in-to-graylog/
Ahh nice! They also released an enterprise version plugin which adds Okta and O365 as plugins directly available in Graylog. Glad you got yours working though! Really like how your site looks by the way.